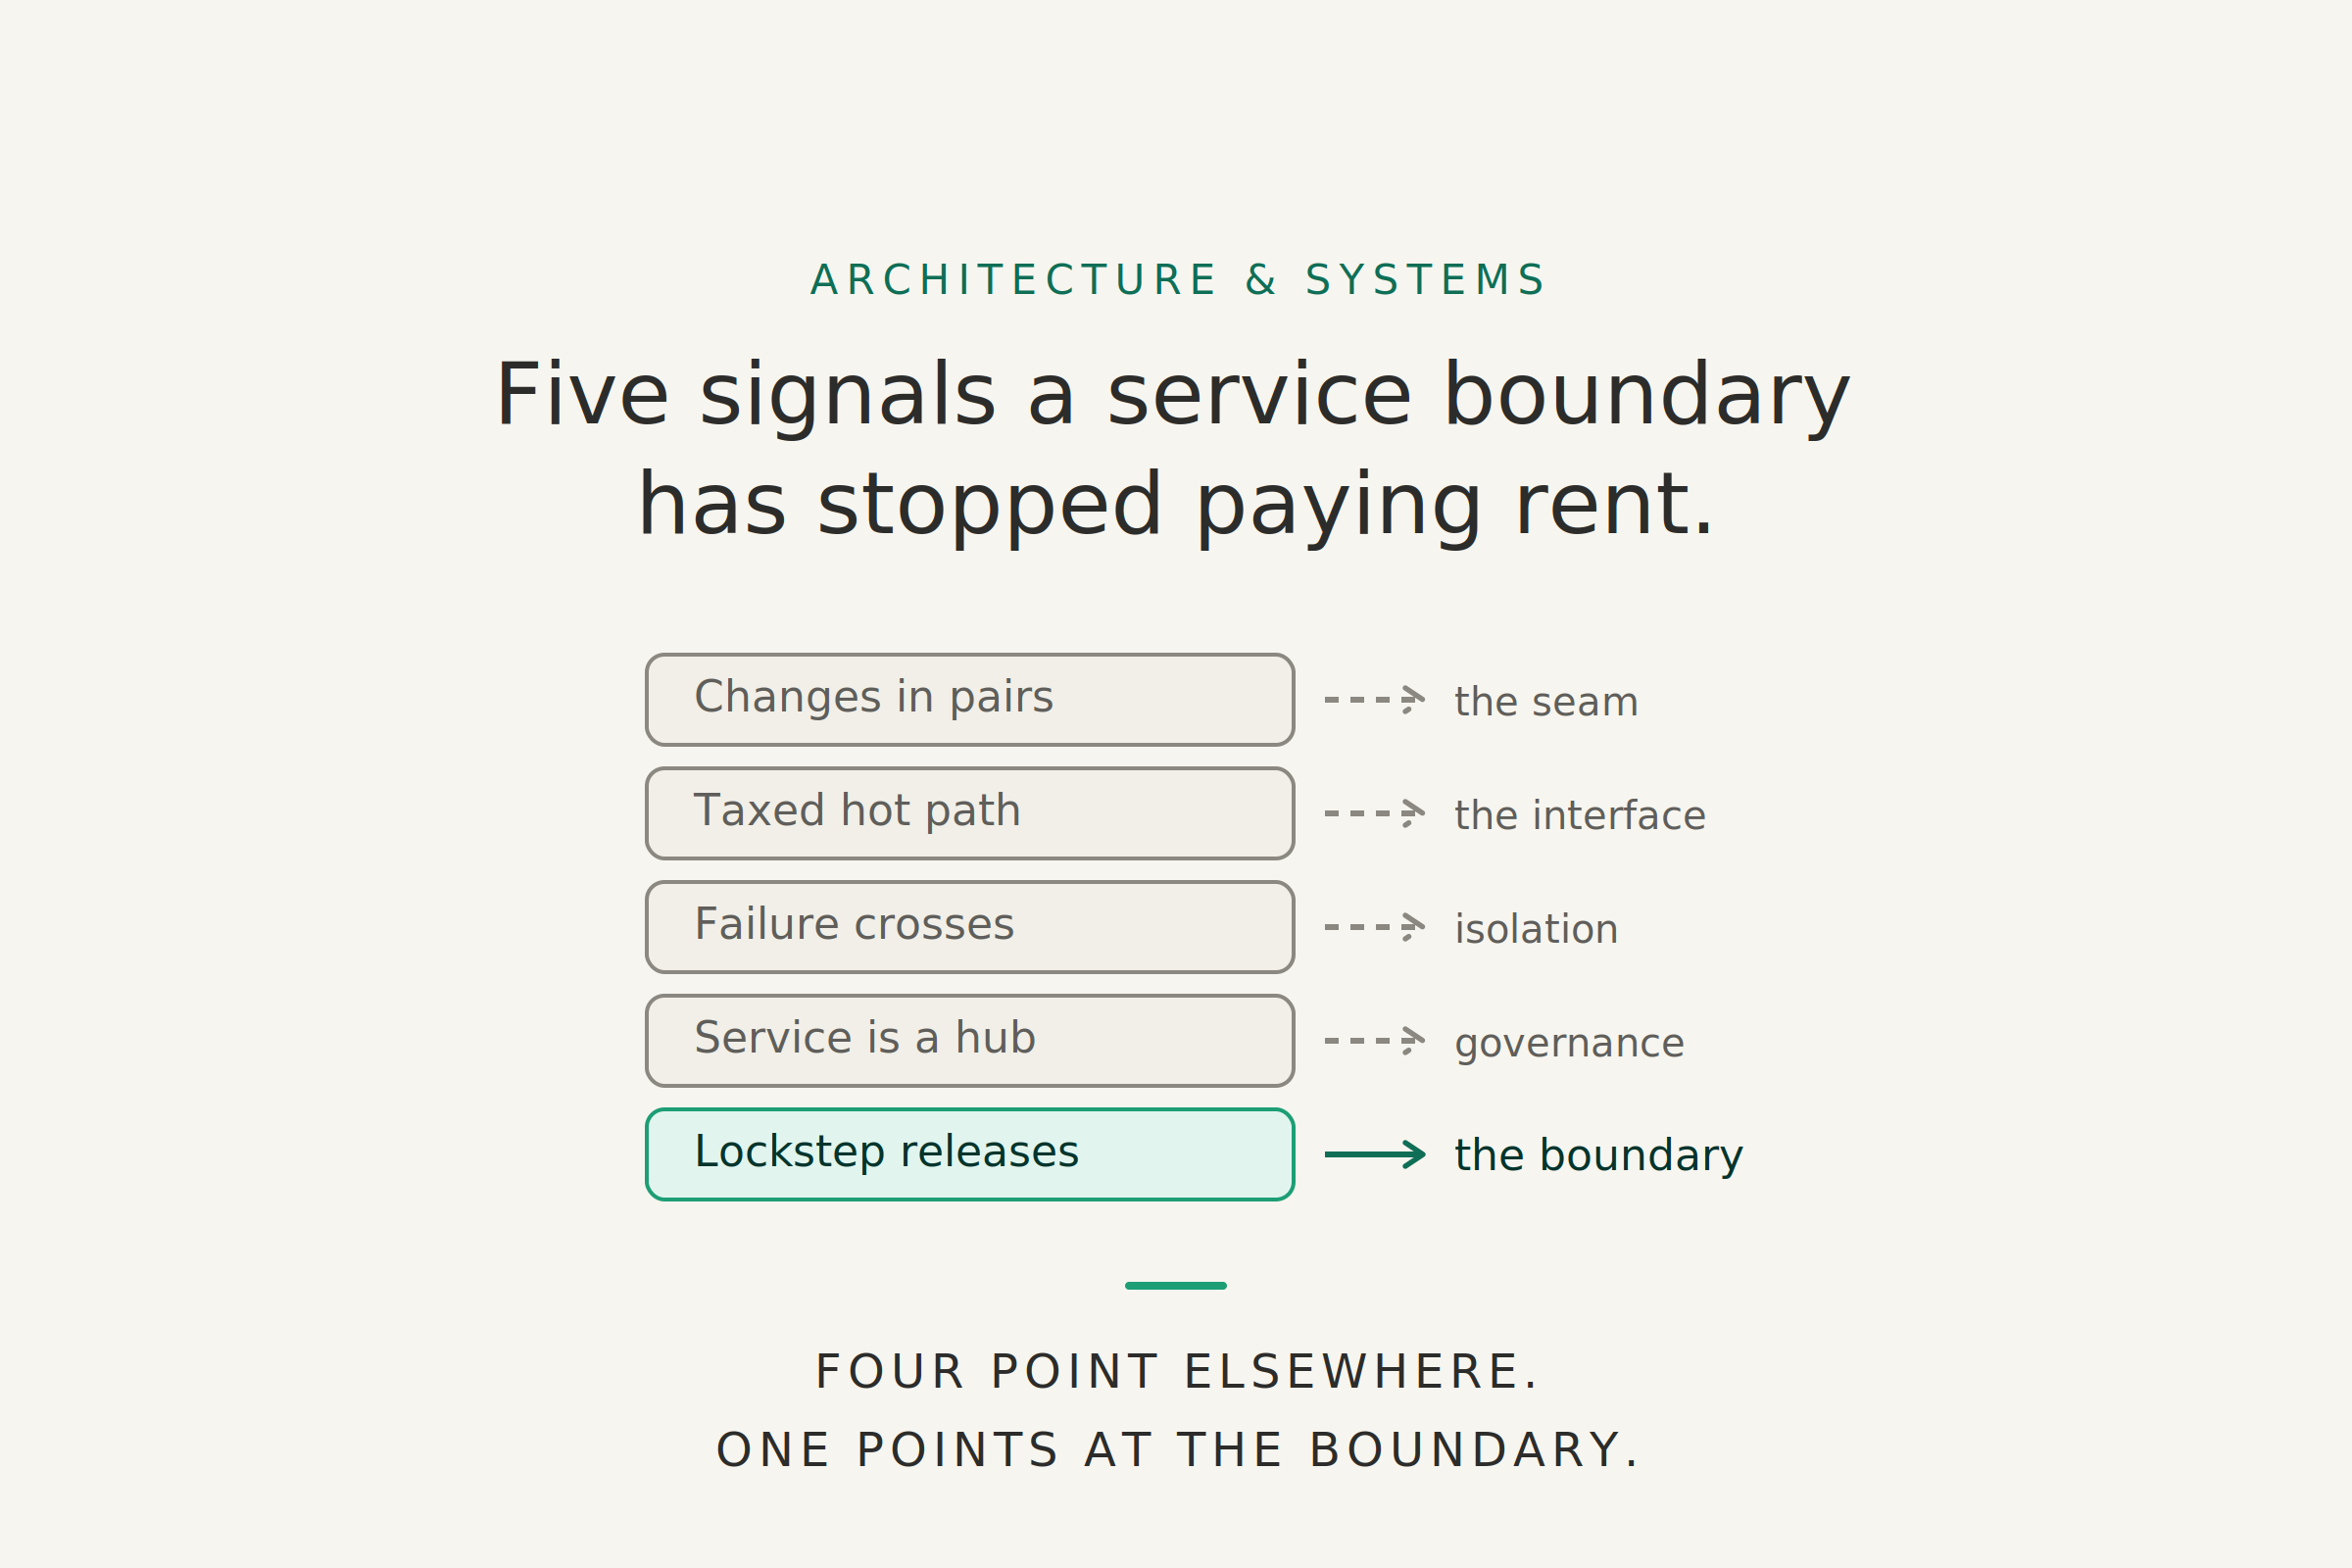
And what each one actually points at, which is rarely a merge.
Two services, one team. Most changes touch both repositories. A cannot be deployed safely unless B follows. When one gets slow, the other starts failing with it. A single checkout request crosses the boundary four times synchronously.
Nobody on that team thinks the architecture is broken. It ships, the dashboards are green most weeks, and if someone did suggest the boundary had outlived its purpose, the conversation would come down to who argues more persuasively. There is no number on the table.
We have a rich vocabulary for splitting software. Extract a service. Find the bounded context. Strangle the monolith. Every step has a named pattern and a migration guide. For the reverse direction there is far less, and what is missing is not the writing but the evidence: a set of measurements that tell you a boundary has stopped earning what it costs, before the argument becomes a matter of taste.
This post is about those measurements. The five below are the ones I keep coming back to, along with the thing each one is actually evidence for, which is almost never “merge these two services.”
What a Boundary Buys, and What It Charges
A service boundary buys real things. One part of the system can be deployed without waiting on another. Expensive workloads can be scaled or isolated independently. Two teams with different roadmaps stop negotiating every release.
It also runs a tab that arrives in increments, which is why it gets underestimated. A function call becomes a network call. An internal interface becomes a versioned contract with a deprecation policy. A local transaction becomes a consistency problem you own now. A stack trace becomes a distributed trace, if context propagation survived the last queue hop.
Some of the bill is arithmetic. Two services that each deliver 99.9%, with their failures approximated as independent, give a serial path near 99.8%. That turns 43 minutes of monthly downtime budget into 86. Neither service got less reliable. What changed is the path, and every extra hop multiplies again. Tail latency compounds less tidily still, since queueing, retries, and correlated load can push the end-to-end P99 well past anything the per-service dashboards suggest.
None of which is a law of nature. A timeout with a real fallback breaks the chain, which is the point of the third signal below: isolation is something you build, not something the boundary hands you. The arithmetic shows the default, and the default is what you get when nobody builds anything.
None of this makes decomposition a bad idea. It means a boundary has to buy something in exchange for what it charges, the exchange rate moves even when the code does not, and having been built is not a reason on its own.
That is harder to notice than it sounds, because decomposition produces a convincing kind of fake progress. Every repo gets easier to read. Every deployment unit shrinks. Local reasoning improves everywhere while global reasoning quietly gets worse, and local reasoning is the only kind most of us do on a Tuesday afternoon.
Read the Graph, Not the Repository
Split a checkout component into Pricing, Inventory, and Promotions and you get three boxes where there was one. The boxes got smaller and the arrows got more important, which is the trade nobody puts on the slide. Each arrow can carry latency, retries, failure propagation, contract evolution, and an ownership handoff. Three small boxes and three arrows is not obviously simpler than one medium box.
So service count is a weak measure of architecture quality. The useful questions are about the graph. Which dependencies sit on the highest-traffic paths? Which boundaries change together? Where does slowness propagate? Which services have quietly become hubs that a dozen customer journeys pass through?
Five Signals
None of these tells you to merge. Each one tells you a specific benefit you assumed you were buying may have stopped arriving. Any one of them is enough to investigate. Several on the same boundary raise the priority and strengthen the case that the boundary itself, rather than one local implementation detail, is what deserves review.
All five are computable with what you already have. Change coupling comes out of git log: how often do commits touching A land in the same window as commits touching B. Release coupling comes out of your deploy records. Call counts and serial depth come out of traces you are probably already sampling. A signal nobody can compute is a signal nobody will check.
Treat them as guardrails rather than targets. Their job is to warn. The moment one becomes something a team is measured on, it stops being evidence and starts being a number somebody manages.
1. Changes arrive in pairs
Dependencies are fine. Every useful system has them. The revealing measurement is change coupling: how often does a change to A force a change to B in the same window? Pick a window that matches your release cadence, since the ratio is what matters rather than the raw number.
Bidirectional coupling is the interesting case. If a change in either direction routinely creates work in the other, independent evolution is no longer something this boundary provides.
Segment’s 2018 account shows the expensive version of this. They ran a separate service per data destination, more than a hundred of them, all depending on the same shared libraries. A library change had to be rolled across a hundred repositories, so it usually was not, and the versions drifted until each destination was running something slightly different. The change coupling was real, and the cost of ignoring it was paid in divergence rather than in coordination meetings.
Before reaching for the obvious remedy, though. A boundary in the wrong place has three fixes: move the misplaced responsibility across, merge, or accept the coordination cost. Merging gets reached for because it is the only one with a name. If pricing logic keeps leaking into the inventory service, moving one module may be the entire fix.
2. The boundary taxes the hot path
Some boundaries get chatty. One customer operation crosses the same seam three, four, six times, or a large share of the request budget is spent waiting on the other side.
The Chatty Threshold I use has two triggers: more than three synchronous remote calls in one request, or remote wait above 40% of end-to-end latency, measured as wall-clock on the critical path rather than summed across concurrent calls. Neither is a law. They are where I stop assuming and start measuring.
Two other measurements sit next to it, and both get conflated with it constantly.
- Sync Hop is serial depth: the number of synchronous stages on the longest customer-visible path. It sets the latency floor. A parallel fan-out to four services counts as four calls but only one stage, assuming they run concurrently and the caller waits once for the group.
- Tail Index is P99 over the median. A rising ratio on the same journey corroborates the story: the interaction surface is degrading while local averages still look fine.
A boundary can be wide, deep, or both, and the fix differs in each case.
In 2023 a team at Prime Video published the clearest public version of this. Their video quality detectors ran as separate serverless components, and frames moved between them through object storage, so transfer cost tracked the thing being analyzed rather than the analysis. Putting the components in one process and passing frames in memory cut infrastructure cost by over ninety percent. The new design scales by cloning the whole unit, a constraint they accepted rather than a free win.
Know the dispute before citing this anywhere. The argument ran for weeks, the original has since vanished from Amazon’s site, and Paul Johnston’s rebuttal is largely right that the headline oversold it. Almost all of it is definitional: whether the result deserves the word monolith, and whether one team optimizing a serverless prototype teaches anything general about microservices. Nobody disputed the part that matters here. Moving data between separated components cost far more than passing it in the same process, whatever you call the architecture on either side.
The trap is that chattiness is often an interface problem wearing a boundary problem’s clothes. Six crossings per request is usually an N+1 or a missing batch endpoint, so coarsen the interface first. If the pattern survives a proper API, the remaining coupling is structural: the domain may be one thing, or the workflow may be owned on the wrong side. Either way the boundary is the subject, not the endpoint.
3. Failure crosses the boundary anyway
Checkout depends synchronously on Pricing for nearly every request. Pricing gets slow, Checkout threads pile up waiting, retries add load, and customers experience an outage of Checkout. Two processes, one failure domain. This is one common symptom of a distributed monolith.
Now the part that usually gets stated backwards. Merging does not fix it. If pricing computation is slow, it is slow in-process too. What merging removes is the illusion of isolation, plus the thread pool exhaustion and retry amplification the network added on top of the original slowness.
So this signal is a fork rather than a conclusion. Either you buy the isolation you thought you had, with bulkheads, timeout hierarchies, retry budgets, and a real fallback for a degraded Pricing, or you stop paying network costs for isolation you never receive. Both are defensible. Paying and not receiving is the only clearly wrong option.
4. One service has become a hub
This is the signal I would put first if the list were ordered by damage.
Start with Dependency Degree, upstream plus downstream, weighted by traffic, change frequency, and data sensitivity. Raw caller count treats every edge as equal, which flatters the wrong services. Hub risk goes further. Connectivity turns dangerous once it combines with business criticality, error-budget burn, and how far a failure travels. Picture a service with eleven callers, four of them on revenue paths: that is shared infrastructure being maintained like a feature service, and one bad deploy there can become a cross-journey incident.
A hub is not automatically a merge candidate or even a design failure. Auth, configuration, and payment gateways earn the position, and three interventions compete for any hub worth worrying about: split it further, buffer it with bulkheads and rate limits and backpressure so shocks stay local, or consolidate it. A thick, well-defended hub is often the cheapest of the three. Eliminating hubs is not the goal.
The distinction worth keeping is governed versus ungoverned. A hub can emerge by design or by accident, and either can be fine. What matters is whether it has an owner, an error budget, containment, and a review mechanism before its connectivity becomes propagation risk.
5. Releases arrive in lockstep
Two pipelines prove nothing on their own. Make it concrete as a Release Coupling Ratio: the share of releases that need coordination with another service or team. The strongest form is lockstep deployment, where A cannot reach production safely unless B goes with it. The ratio is the one number here that maps directly onto a promise the boundary made when it was created.
A caveat, because this gets conflated constantly. Shipping two features on the same day is not release coupling. You can deploy A and B independently for weeks and flip a flag for both at once, and that is a coordinated product launch, which is fine. The ratio is about what it takes to reach production, not about when a customer sees the result.
Of the five, this is the one that most often ends an argument. The other four leave room to debate whether the boundary or its surroundings are at fault. A high Release Coupling Ratio does not, because independent deployability was the promise, and the number says the promise is not being kept.
Not a signal: shared ownership
One team owning both services is not evidence of a bad boundary. Teams own five services all the time and that is normal. Ownership does belong in the analysis from the start, because making responsibility clear is one of the things a boundary exists to do. What it will not do is settle the merge question by itself.
What it does change is the price. When one team owns both sides, merging avoids a cross-team reorganization, though the data migration, runtime, scaling, and security work is unchanged. When two teams own them, all of that still applies and an organizational negotiation with a headcount conversation sits on top. Same technical evidence, materially different project.
Where Each Signal Points
The five do not converge on one answer, and pretending they do is how essays like this go wrong.

Four of the five can fire on a boundary that should stay exactly where it is. A chatty seam usually wants a better API. A hub usually wants governance and containment, not demolition. Failure that crosses the boundary usually wants bulkheads, because merging removes the illusion of isolation rather than granting the real thing.
The fifth is different. Independent deployability is not a property you can add to a boundary from the outside. Either the two things can ship apart or they cannot, and no amount of tooling around the edges changes that. When release coupling is the signal that fires, the boundary itself is the subject.
One thing no single reading can show you is direction. A boundary that looks bad this quarter may be recovering from a migration. A boundary whose release coupling and tail metrics have not improved across two consecutive reviews is the one worth acting on, and that difference is only visible if somebody wrote the first number down.
The Point Is the Evidence, Not the Verdict
The hard case is never the obviously bad boundary. It is the boundary whose value declined four percent a quarter for three years, which nobody ever observed as a change. Slow declines need a measurement to be visible at all.
So the useful output of this list is not a merge proposal. It is a sentence a team can agree on. Something like: we bought this boundary for independent deployability, seven out of ten releases now need the other side shipped with them, and we are still paying network and contract costs for something that stopped arriving a year ago. That sentence beats any threshold in this post, because nobody wins an argument about architectural taste and somebody can lose an argument about a number.
Rent has a due date. These five measurements are how you find out whether the last few payments went through. What to do when they did not is a separate decision with more than one right answer, and that is the subject of the follow-up.
These measurements come from Chapter 3, “The Illusion of Small Services,” in Beyond Microservices: Building Systems That Align Architecture, Teams, and Flow.
Leave a Reply